|
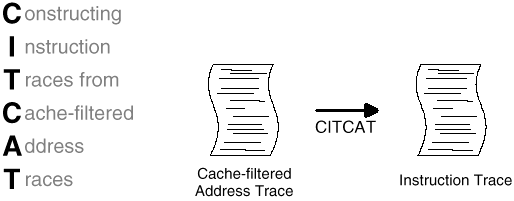
Fig. 1: CITCAT is a procedure that generates full instruction traces from cache-filtered address traces. |
by Charlton D. Rose
A thesis submitted to the faculty of Brigham Young University in partial fulfillment of the requirements for the degree of Master of Science.
Department of Computer Science
Brigham Young University
April 1999
AbstractTraces are valuable to computer architects because they allow researchers to subject hypothetical systems to real workloads using trace-driven simulation. An instruction trace is a record of a processor's instruction-level activity, including the opcode and operands of each instruction. In general, traces affected by the tracing process have limited utility. However, instruction traces are nearly impossible to collect without perturbing the system being traced. In the past, researchers have taken several approaches towards collecting traces, such as (trap based) single stepping, inlining, hardware monitoring, and processor simulation. These approaches fail to produce accurate traces because they interfere with the processor's normal execution or are too difficult to implement correctly. Because processors are deterministic machines, their behavior can be predicted if their initial states and external inputs are known. CITCAT is a procedure that exploits this fact to generate nearly perfect instruction traces using trace-driven simulation. CITCAT combines the best features of traditional tracing techniques to produce long, accurate instruction traces from cache-filtered address traces (CATs), which can easily be collected without perturbing the system being traced. Successful implementations of CITCAT require a processor simulator, the ability to initialize it with the state of an actual machine, and the ability to simulate a realistic sequence of asynchronous events. The simulator is initialized with an initial machine state (IMS) image, while events are simulated according to an asynchronous event schedule (AES). Both of these records are extracted from a single CAT. Because the simulator replays the instruction sequence executed by the original processor that produced the CAT, it is possible to convert the CAT into any type of system trace. The feasibility of CITCAT is demonstrated through an implementation on a MIPS R4400 microprocessor based system. System-specific challenges are overcome with system-specific solutions, and efforts to generate instruction traces are ultimately successful. An R4400 CITCAT driver and other operating system patches, and how they enable the generation of IMS and AES records, are described. Because CITCAT instruction traces are computed, rather than stored, CITCAT has potential for development as an extremely efficient, lossless trace compression algorithm. |
New design strategies for computer systems are often evaluated through software-based simulation in order to determine whether they are worthy of implementation. During simulation, researchers attempt to subject the simulated system to realistic demands, and then monitor the system's response to those conditions. Data gathered from the simulation is then used to identify strengths and weaknesses in the hypothetical system.
If the simulation is accurate, then the usefulness of the results depends on the plausibility of the test cases. Because of this, most researchers prefer test cases that are based on actual observations. These test cases can be obtained by measuring and recording the properties of an actual system as it operates under the desired conditions. The resulting data sequences, or traces, can then be used to measure the response of the hypothetical system to non-hypothetical operating conditions. This method of experimentation is called trace driven simulation.
Trace-driven simulation is a well-used and well-accepted experimental procedure in computer science. An informal survey of three major conference proceedings has revealed that
Approximately 23% of the accepted papers at three major conferences (ISCA 24, ASPLOS VII, and MICRO-30) dealing with computer system architecture and performance use trace-driven simulation to acquire their experimental results. . . . Most of the trace data used was representative of scientific workloads such as the integer and floating point SPEC benchmarks. [From this,] two observations can be made. . . . First, there is certainly a need for trace data since nearly a quarter of all the work found worthy of publication at these prestigious conferences use it. Second, there is a real need for trace data representative of other workloads such as transaction processing, real time applications, multimedia applications, teleconferencing, video streams, and entertainment software such as games [1].
Many features of a system's behavior can be traced, including disk accesses, network activity, and cache performance. Perhaps the most useful and sought-after type of trace is the instruction trace, since instruction traces are rich with data about every aspect of the system and can often be converted into other types of traces.
An instruction trace is a record of a processor's instruction-level activity, listing the instructions executed as well as the operands of each instruction. Instruction traces make it possible for researchers to closely examine a processor's behavior [2, 3, 4], identify performance bottlenecks [5, 6], and plan architectural revisions [7].
Unfortunately, an accurate instruction trace is one of the most difficult types of trace to obtain. This is because most of the known processor-tracing techniques have limitations that compromise the validity of the traces obtained. For example, many tracing techniques adversely affect the system's overall performance, resulting in trace data representing a degraded machine rather than the original machine from which the trace was sought.
This thesis summarizes traditional processor tracing techniques and explains why traces obtained using these methods are of questionable quality. More importantly, however, this thesis also describes an alternative tracing technique: CITCAT, a hybrid tracing approach that combines features of traditional tracing techniques — and several new ideas — to generate accurate and realistic instruction traces. The most significant feature of CITCAT is that it allows researchers to convert cache-filtered address traces, which are easy to collect, into accurate instruction traces, which are difficult to collect.
The objective of this thesis is to demonstrate that it is possible to convert cache-filtered address traces into complete instruction traces. To show this, CITCAT has been implemented on a MIPS R4400 microprocessor-based computer system. Implementation details are described, findings from a successful trial run are reported, and directions for future research are proposed.
The following definition is submitted:
A trace is "perfect" if it (a) has been recorded from an unperturbed system [8], (b) is based on a relevant workload, (c) is continuous (i.e., no missing sections), and (d) is long enough to be useful in the research where it is applied.
It may be possible to obtain long, continuous traces from a perturbed system, or even to concatenate short bursts of traces from an unperturbed system, but neither of these methods results in "perfect" traces. For may types of studies, it may actually be impossible to generate traces that can be considered "perfect" for those studies. However, researchers should attempt to come as close to this goal as possible, since even slight inaccuracies in trace data can have dramatic impacts on the results of trace-driven simulation based studies [9, 10, 11, 12, 13].
Many tracing techniques exist and are commonly used, such as trapping, inlining, hardware monitoring, and processor simulation. However, most methods fail to produce perfect — or even "nearly perfect" — instruction traces because they usually require the system's extensive participation in its own tracing, thereby affecting the system's behavior and workload.
Many processors have integrated, trap-based debugging features that allow them to operate in "single stepping" mode. In this mode, the processor automatically interrupts the current program after each instruction and transfers control to a designated debugging routine. After the debugging routine has performed its task, it returns processor control back to the original program, which is then allowed to execute one more instruction.
An easy way to generate instruction traces is to configure the debugging routine to output instruction trace data after each instruction. Single step instruction tracing is straightforward and relatively easy to implement, but it also has several significant drawbacks. First, the cost of processing an interrupt between each instruction is tremendous, and usually becomes a serious performance bottleneck in the system. On some systems, for example, single stepping can dilate the processor's execution speed by a factor of 1000 times or more [8]. As a result, instruction traces gathered through this process reflect the activities of an entirely different, degraded machine.
Furthermore, repeated execution of the debugging routine means that the routine will always occupy an unfair share of the system's performance-enhancing features, such as caches and TLBs, resulting in poorer performance for these components, too.
Another limitation of single stepping is that, in many systems, it is difficult to single-step through certain instruction blocks, such as operating system calls. For example, single stepping may not be possible in critical sections because interrupts must be disabled.
There are several varieties of single stepping, not all of which require the processor to be interrupted after each instruction. However, single stepping — and its variants — are all plagued by the same defect: they require the processor's extensive participation in its own tracing.
To avoid some of the problems associated with single-stepping, many researchers [4, 8, 13, 14, 15] have recorded traces using inlining, or code modification techniques. These techniques are similar to single stepping, except that rather than causing interrupts between instructions, the software being executed is modified so that it generates its own trace output. Because this technique avoids most of the overhead associated with per-instruction interrupt processing, it is significantly better than single step tracing.
Rather than inserting tracing code between each instruction, it is more efficient to insert extra code at the beginning of each basic block, which reports, in some manner, the identity of the block being executed. Afterwards, the resulting basic block trace can be converted into an instruction trace.
Inlining has several advantages over single stepping. First, as mentioned above, the overhead of frequent interrupt processing is completely avoided, resulting in huge time savings and, consequently, much better system performance. Second, inlining is more adaptable to supervised code tracing, making it possible to generate complete instruction traces.
On the other hand, inlining still carries many of the weaknesses of single stepping. Assuming, for example, that the average basic block is 6 instructions long [16], adding just one instruction per block can inflate a program's size by 17%. This significantly affects system performance, ultimately affecting the quality of the trace.
Also, even if we were able to determine, from a basic block trace, which instructions were executed, we would still have difficulty deducing, with complete certainty, what each of the instructions accomplished. For example, a derived instruction trace might contain a "Load Word" instruction, but the address or contents of that word might not be apparent. Additionally, because basic blocks are not necessarily atomic (interrupts may occur within blocks), basic block traces would only allow us to derive approximate instruction streams.
Like single stepping, the flaws of inline techniques are too obvious to ignore, and severely limit the value of the traces. Again, because the system is heavily involved in its own tracing, the processor cannot perform naturally, and the resulting trace is polluted.
Many processor chips and motherboards can be monitored by logic analyzers and other hardware monitors [2, 6, 7, 17, 19, 20, 21]. If a fast-enough hardware monitor is used, equipped with a sufficiently large recording buffer, it may be possible to record perfect instruction traces without ever disturbing the system. Unfortunately, it is difficult, if not impossible, to access real-time, instruction-level information from most processors, particularly since the required information is not usually signaled at externally accessible locations in the system [2].
Even if we found a way to access real time, instruction-level information from a running processor, we would still be challenged by the hardware monitor's limited storage capacity. The buffers on most hardware monitors are capable of storing perhaps a few seconds of instruction activity, but an instruction trace long enough to be considered "statistically significant" should span a much longer period of time [13]. It may be possible, perhaps, to periodically empty the buffer into a large-capacity secondary storage device [17, 21], but it is unlikely that such a device could accept data at the rate it was generated.
Still, hardware monitoring has much to offer researchers who are seeking instruction traces. The CITCAT instruction tracing procedure, described later in this thesis, depends heavily on the hardware monitor's ability to record system events in real time, without perturbing the system. As we shall see, CITCAT can reduce the rate at which data must be recorded, making real time tracing techniques more viable.
Processor simulation is a completely different approach to tracing. By simulating a processor's behavior in software, it is possible to monitor and record every aspect of the system without affecting its behavior [22, 23]. If the system is modeled and simulated correctly, the simulator will be capable of generating "perfect" instruction traces.
Unfortunately, completely perfect system simulation is not an easy goal to reach. In order to guarantee accurate simulation, several requirements must be fulfilled:
The simulator must execute each instruction correctly.
The simulator must correctly model the behavior of peripherals connected to the processor, such as SCSI controllers, network cards, etc.
The simulator should take into account the timing of each instruction, so that internal asynchronous events, such as "timer ticks," and external events, such as hardware interrupts, can be simulated at precisely the right moments. (This may require gate-level simulation.)
If the software running in a simulated system requires real-time, continuous interaction with a human, such as in an interactive game, then special measures must be taken to simulate the user as well. A real user should not be used because the simulated system will not run at real time speeds [22, 23], and a human cannot be expected to respond to a slow machine in the same manner as he would to a real machine.
Obtaining or writing accurate, instruction-level simulators is relatively easy. Software that is capable of meeting the above requirements, however, is difficult to obtain and even more difficult to implement — especially when proprietary information about the processor and connected hardware is unavailable.
Several types of instruction tracing techniques have been described. Single stepping techniques exploit processor-supported, instruction level debugging facilities to obtain instruction information. Inline techniques alter the software being executed so that the programs being traced actually assist in their own tracing. Both of these techniques require significant system perturbation and produce low-grade traces.
Hardware monitoring is useful for extracting system run-time information from electrical signals visible at hardware interfaces, but there is usually not enough information to derive an instruction trace directly. Software-based processor simulation, on the other hand, allows the user to non-intrusively probe every aspect of the system. Unfortunately, complete simulation is difficult when the system must interact with the world around it.
The remainder of this thesis describes an instruction tracing technique that combines the best features of "legacy" tracing techniques while avoiding the pitfalls usually associated with them.
A new instruction tracing technique has been developed that combines the best features of inlining, hardware monitoring, and processor simulation to generate accurate instruction traces, or traces that characterize real machines operating under normal, unperturbed conditions. This technique is affectionately named "CITCAT," an abbreviation for "Constructing Instruction Traces from Cache-filtered Address Traces." CITCAT is capable of generating long, continuous, and accurate instruction traces from cache-filtered address traces [24].
|
Fig. 1: CITCAT is a procedure that generates full instruction traces from cache-filtered address traces. |
The underlying premise of CITCAT is that processors are deterministic, finite state machines. In other words, given the state of a processor at time t, and a complete knowledge of external influences acting on the processor between times t and t + Dt, it is possible to predict, with accuracy, the state of the processor at time t + Dt. Because of this, a simulator can reproduce the exact behavior of a processor given only two sets of data:
initial machine state (IMS): state of the processor, caches, and main memory at the beginning of the tracing period
asynchronous event schedule (AES): schedule of hardware interrupts, DMA, and other asynchronous or peripheral events that influence the processor during tracing
With both of these records, an exact instruction trace can be generated through processor simulation using the following procedure:
Initialize the processor with the initial processor state, including the program counter, registers, flags, TLB entries, etc.
Initialize main memory and caches with the initial memory image.
Execute the instruction at the program counter.
Record trace data for the instruction just executed.
Check the asynchronous event schedule to see if it is time to simulate an asynchronous event.
If it's time for an event, simulate it by changing control registers (indicating an interrupt), modifying main memory (to simulate DMA), or performing any other appropriate state modification.
If the event schedule still contains future events, return to step 3 and repeat.
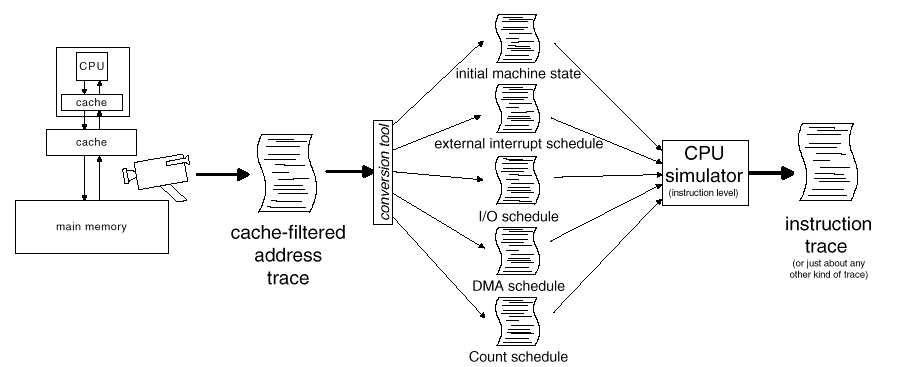
Of course, an instruction trace is not very useful unless it represents the workload of an actual machine. Thus, a mechanism is required to obtain an IMS and AES from a real machine. This implies that CITCAT is a two-phase process: In the first phase, an IMS and AES is extracted from a real machine, and in the second phase, a simulator is used to reenact the traced machine's instruction-level behavior.
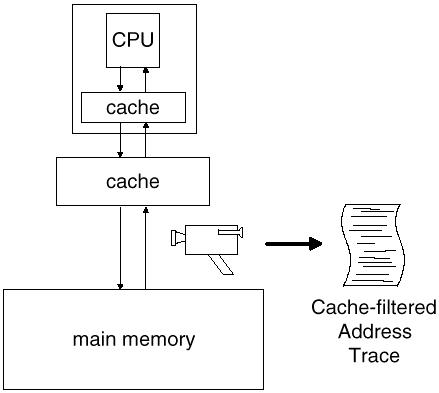
In most systems, the processor is not directly connected to the system's main memory. Instead, there are usually one or two levels of performance-enhancing caches in-between. Each cache serves as a "short term memory," in the sense that if a certain element of data has been handled very recently, it can be found in the cache and recalled very quickly. Because most of a processor's memory requests involve recently accessed addresses [25], only a small fraction of these requests actually appears on the main system bus. Addresses that appear on the bus are called cache-filtered addresses (Fig. 2).
|
Fig. 2: Collecting cache-filtered address traces (CATs). A hardware monitor is connected to the main system bus, where cache-filtered memory traffic and other system events, such as I/O and DMA, can be observed and recorded. |
The term "cache-filtered address trace" (CAT), as it appears in this thesis, is slightly misleading because it implies we are only interested in addresses. Although there have been many useful studies based on address traces where the values stored at each address were irrelevant, CITCAT actually requires that both the addresses and the data be recorded. Hence, wherever the term "address traces" is used, keep in mind that the data is important, too.
It is not extremely difficult to connect a hardware monitor to the system bus and record cache-filtered memory activity [17]. Often, in addition to cache-filtered memory activity, other types of events will also appear on the bus, such as device I/O, hardware interrupts, and DMA. The fact that these events can also be captured in a CAT turns out to be quite useful in Phase II of CITCAT, in particular, for generating the AES.
After making a few minor modifications to the operating system software, prior to tracing, it is possible to generate a CAT that contains enough information to derive both the required IMS and AES records. Equipped with this data, one can then use a processor simulator to transform the cache-filtered address trace into its equivalent instruction trace.
An initial machine state for CITCAT should represent at least the following components of the traced system:
the state of the processor, including its general purpose registers, control registers, program counter, etc., and
the state of the memory subsystem, including TLBs, caches, and main memory.
For a normal system, it is not likely that all of this information can be derived from an ordinary CAT. Usually, a special driver must be used to ensure that this data appears in the CAT during tracing. This CITCAT driver performs three main tasks:
signals the hardware monitor to begin tracing,
invalidates the caches, and
outputs the processor's register state.
The first step is necessary to ensure that the IMS will appear at the beginning of the trace. Rather than worrying about how to invoke the driver after tracing begins, it is simply easier to define the driver's execution as the beginning of the trace. A begin_tracing signal is easily sent to the hardware monitor by means of a "magic" uncached store, which the hardware monitor has been configured to recognize.
The second step, invalidating the caches, guarantees that the initial memory image can be extracted from the trace. If the trace begins with empty caches, then the processor's first references to each memory address will "miss" in the caches and therefore appear on the bus. After the trace has terminated, a trace processing program extracts the initial memory image.
This approach has three advantages. First, it is not necessary to record a complete memory image, since only the addresses that are actually referenced during the tracing period will appear in the CAT. Second, addresses that are written before read can be safely ignored, since the initial values at those addresses will never be used in the simulation. Finally, by invalidating the caches at the beginning of the trace, the need to record the state of the caches is eliminated. These three features greatly reduce the storage requirements of the IMS.
In the third step, the processor's registers are output in a manner that ensures they will be recorded in the CAT. Uncached stores to reserved addresses are suitable for this purpose and make it easy to extract the processor's state from the trace afterwards. Different addresses should be chosen for each register to avoid confusion.
It may seem like invoking a driver to perform these three steps would result in significant system perturbation, thereby devaluing the resulting trace. Certainly, a procedure as drastic as cache invalidation has a huge impact on system performance. However, after the system has run for a short period of time, and the caches have warmed up, the impact of the driver on the overall trace is negligible if the trace is long enough. Furthermore, since the impact is localized to the beginning of the trace, a purer trace can be obtained simply by discarding the first part of the trace.
Although an IMS is sufficient to initialize a simulator, an asychronous event schedule (AES) is required to keep it on track. In other words, if a simulator is going to recreate the same instruction stream as the original processor that was traced, the simulator must respond to the same pattern of external influences as was experienced by the original machine. This requires an accurate external event schedule that the software can use to simulate these effects.
Depending on the system, a sufficient AES contains many types of events, including hardware interrupts, DMA, and other external events that can influence the processor's course. Ideally, each event in an AES should be time-stamped, either implicitly or explicitly, so that the simulator, during execution, can determine the precise moment to simulate it.
The best technique for integrating an AES into an address trace depends largely on the architecture of the system being traced, so it is difficult to describe a general procedure that works for all systems. However, there are several key ideas worth considering.
1. As mentioned earlier, valuable information about many types of aynchronous events will appear directly on the bus, and can thus be easily recorded in a CAT. These events may include hardware interrupts, device I/O, and DMA. If these events manifest themselves on the bus, it will be possible to scan the CAT for asynchronous events that effect the processer, so that an AES can be generated directly from the trace.
2. In many cases, however, this information will be incomplete. For example, it may be possible to determine that DMA occurred, but the precise time of the DMA may be uncertain. Unfortunately, obtaining accurate timing information for asynchronous events is probably the most difficult part of generating an AES. If the timing data isn't implicitly embedded in the trace, it may be difficult to proceed.
3. Fortunately, most advanced processors provide external status pins that act as windows into the processor. These pins provide real-time data about the processor's internal state, signaling the processor's response to an interrupt, the number of branch instructions executed, the processor's current run level (kernel, supervisor, user), etc. [18]. If this data can be helpful in building an AES, then it should be monitored and recorded concurrently with the CAT.
4. In most cases, it will probably be necessary to modify the operating system code so that it reports, in the CAT, responses to certain types of events that cannot easily be traced any other way. Although tracing techniques that require processor involvement jeopardize the value of the resulting traces, in some situations there may be no choice. Modifications should certainly be kept to a minimum so that the overall performance impact on the system is small.
Whatever techniques you use for your particular system, your goal should be to make sure that enough information will be recorded in the address trace to allow an AES to be extracted from it. This AES must be detailed enough to recreate the effects of all events that affect the processor.
A cache-filtered address trace (CAT) is easy to record with a hardware monitor connected to the system bus between the caches and main memory. Properly configured, the hardware monitor can incorporate into the trace information about the processor's runtime behavior as well as asynchronous events that affect the system. The operating system must be configured to output initial machine state (IMS) data and may require additional modifications to support integration of the asynchronous event schedule (AES) into the CAT. After the IMS and AES have been acquired, a processor simulator can use them to recreate the original instruction sequence.
The following chapter describes a successful implementation of CITCAT on a MIPS R4400 microprocessor-based system, including system-specific challenges that had to be addressed in order to make CITCAT possible.
To demonstrate the viability of CITCAT, I teamed up with Tandem Computers, Inc. to generate an instruction trace for a MIPS R4400 microprocessor-based system. Tandem executed most of Phase I of the project, and I completed most of Phase II. Together, we demonstrated that the CITCAT procedure works — that an instruction trace in fact can be generated from a carefully prepared cache-filtered address trace. This section describes system-specific techniques required to implement CITCAT on a MIPS R4400 microprocessor-based system.
The CITCAT driver for the R4400 system was not complicated and did not require special considerations beyond what is discussed in the previous chapter. When invoked, the driver transmitted a begin_tracing signal to the hardware monitor, invalidated the caches, and output the processor's registers to carefully-chosen addresses. Uncached stores were used to ensure the data would appear in the trace. The driver also wrote into the CAT the contents of the processor's 48-entry TLB, so that the simulator's TLB could be similarly initialized. After tracing was complete, custom-built trace processing tools were used to scan the CAT and generate the IMS.
Generating the AES was slightly more complicated. The event schedule included the following (Fig. 3):
Asynchronous interrupts, such as from externally-connected hardware, but also including internal interrupts, such as from the processor's internal timer.
Device register I/O, which appeared on the bus as uncached loads and stores to addresses with the most significant bit set.
DMA events, which appeared on the bus as normal memory traffic but were distinguishable by special bus signals.
Count register history, or sequence of values obtained from the processor's Count register when it was read.
For the R4400 system, each of these event types required special consideration.
|
Fig. 3: CITCAT on a MIPS R4400 microprocessor-based system. A hardware monitor records a cache-filtered address trace, which is converted into several records. These records are used to drive a processor simulation that generates the original instruction trace. |
In Phase I, to facilitate integration of asynchronous interrupt data into the CAT, the operating system's general exception handler was modified so that it would output, via uncached stores, the values of critical processor registers that characterized the interrupts. These R4400 registers included EPC (address of interrupted instruction), Cause (reason for interrupt), and several others. A custom counter was also built which tracked, by means of signals on the processor pins, the number of branch instructions processed during the trace. By recording the current branch count each time an interrupt occurred, it was possible to identify the basic block where each interrupt occurred. Although this data had to be saved in a separate, concurrently collected trace, it was easily merged with the main CAT after tracing was complete.
During Phase II, as the simulator reenacted the original processor's instruction sequence, it counted branch instructions to identify basic blocks where interrupts had occurred. After entering the correct basic block, the simulator then waited until the PC register equaled the value of the EPC register that had been recorded during that interrupt in Phase I. When the correct instruction boundary was reached, the simulator modified the processor's control registers to evoke an interrupt response. In this manner, the simulator was able to recreate the original machine's interrupt response.
Relying on interrupt records embedded in the CAT by the exception handler, rather than the actual hardware signals that appeared on the bus to cause the interrupt in the first place, greatly simplified the problem of interrupt simulation without sacrificing too much accuracy. This technique allowed us to avoid difficult questions, such as "How soon after an interrupt signal appears in the trace does the processor respond to it?"
More importantly, this technique also allowed us to simulate interrupts that were difficult to track with the hardware monitor. For example, the R4400 has an internal timer which causes regular, asynchronous interrupts. Accurately modeling this timer in a simulator would have been extremely difficult, since it runs independently of instruction progress, and perhaps would have required gate-level or pipeline-level simulation. Obviously, instruction-level simulators are much easier to work with, so modifying the exception handler to output interrupt records turned out to be an extremely attractive and effective alternative.
In examining our CAT, we found that the processor occasionally read certain values from high addresses, and then later read different values from those same addresses, even though the processor had not written new values and DMA had not occurred. We learned that these addresses were not actually memory locations, but peripheral I/O ports, which served as communication channels between the processor and certain I/O devices. Fortunately, because these ports were always accessed by means of uncached loads and stores to a restricted set of addresses, they were quite easy to identify in the trace.
To support these I/O ports in our simulator, we simply pre-scanned the CAT for I/O activity and recorded each read or write event in a queue. Then, during simulation, whenever the processor called for input, the simulator simply consumed a word from the queue. When it was time for output, on the other hand, the simulator simply compared the value generated by the processor to the next value in the queue, and then discarded it. (Although it was not strictly necessary to process output values, doing so helped confirm that the simulator was behaving correctly.)
Timing issues were unimportant for I/O simulation, since all of the accesses occurred in a synchronous, well-defined, and predictable order determined by the processor simulation.
For DMA, however, timing turned out to be extremely important, primarily because DMA events occurred asynchronously with respect to the processor. Obviously, to simulate DMA, all the simulator had to do was modify the appropriate memory locations at the correct moments during the simulation. Although simulated DMA timing did not have to be precise, it was at least necessary to ensure that each event was executed between the processor's previous and next accesses to the affected addresses. To correctly time these events, the simulator scanned the CAT as it ran, searching for DMA events, and then applied the DMA values to main memory at the correct moments, using contextual clues from the trace to determine when those moments should be. DMA events were identified by special bus signals associated with them in the CAT.
The R4400 has a control register, called Count, whose value monotonically increases at "half the maximum instruction issue rate" [26]. The operating system has various uses for this register, such as timing, random number generation, etc. Obviously, it is nearly impossible to correctly model the Count register in an instruction-level simulator, since its value is directly related to processor timing.
To avoid this problem, the operating system was modified, prior to address tracing, so that whenever it read a value from the Count register, it also wrote that same value to an uncached address in memory. As a result, all values obtained from Count were serialized and logged in the CAT.
Fortunately, there were only a few locations in the kernel where the Count register was actually read, and since Count is not accessible from non-privileged code [26], we did not have to worry about other software that might access it.
With the Count register trace extracted from the CAT, it was easy to emulate the Count register's behavior during simulation. Whenever Count was read, the simulator simply consumed the next value from the Count value queue, in much the same manner as I/O values were consumed.
By describing the techniques required to implement CITCAT on an R4400-based system, this chapter demonstrates that CITCAT requires special considerations for specific processors and system architectures. Although both an IMS and AES are required for CITCAT to work, the emphasis of this chapter is on techniques related to AES generation. This is appropriate since, in general, producing an AES requires much more effort and painstaking consideration than producing an IMS.
Although implementing CITCAT on an R4400-based system was by no means easy, the experiment was indeed successful. Both the instruction and cache-filtered address traces generated by our simulator correlated perfectly with the data recorded from the original machine, and there was no evidence of divergence between the real and simulation machines' behaviors. In fact, a CAT generated by the simulator, which included memory references, instruction prefetches, device register I/O, interrupts, and bidirectional DMA, correlated perfectly with the original CAT.
The main objective of CITCAT is to generate "nearly perfect instruction traces," i.e., instruction traces that tell exactly what the processor in the original, mostly unperturbed system did during the tracing interval. Although CITCAT may never be capable of generating perfect instruction traces (because some perturbation is almost always necessary to support it), we shall see in the coming analysis that it comes quite close. We shall also discover that CITCAT offers, as a nice side-effect, a remarkable ability to reduce the storage requirements for instruction traces.
During the tracing interval used in this case study, the processor frequently visited the operating system's idle loop as it blocked for I/O events. However, because "while(1);" loops are typically uninteresting to most researchers, our final, regenerated instruction stream omits them, and they are not allowed to influence the analysis that follows.
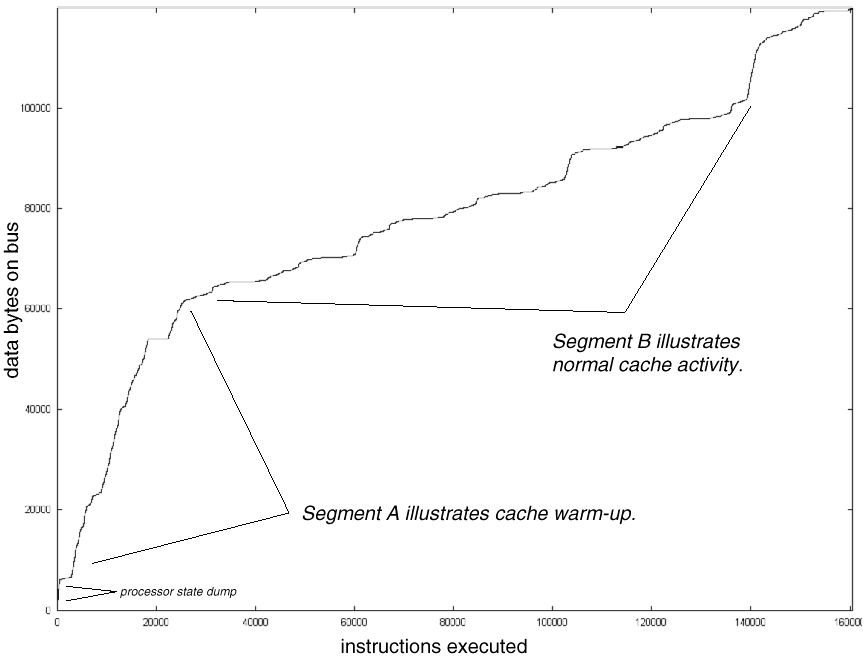
Since CITCAT converts cache-filtered address traces into instruction traces, it is natural to wonder how much CAT data is required to generate an instruction stream of a certain length. Fig. 4 illustrates, for the sample trace, the amount of cache-filtered activity recorded by the hardware monitor as instructions were executed.
|
Fig. 4: System bus events per instructions executed. Steep slopes correspond to poor cache performance or increased DMA. |
In this plot, horizontal segments indicate periods of perfect cache performance, while steep segments represent either poor cache performance or increased DMA. Segment A shows that, initially, the ratio of system bus activity per instruction is very high. This is to be expected, since the traced system must recover from the initial disruption caused by CITCAT when tracing began. (Recall that, at the beginning of the trace, the caches were invalidated and the initial state data was written directly to the bus.)
After the caches "warm up," however, the ratio of system bus activity per instruction improves, as shown in Segment B. Here, the slope levels out to about 0.4 bytes of CAT data per instruction, and the rate at which bus activity must be recorded significantly decreases. Although the poor cache performance in Segment A is undesirable because it pollutes the instruction trace, it is acceptable because it happens only once, at the beginning of the trace. It is the behavior of the system after warm-up that has the greatest impact on the CAT/IT ratio.
As noted earlier, the primary objective of CITCAT is to collect instruction traces without perturbing the system. In this case study, we found that aside from the initial disruption required to start CITCAT, non-perturbation was nearly achieved.
The impact of CITCAT on the system was measuring by examining the instruction trace and counting the extra operations required to support it. Excluding initialization overhead, the extra processor effort was determined to be just a few instructions per interrupt. Since the natural overhead of interrupts was already quite high, these few extra instructions did not make a significant difference in system performance.
The previous chapter describes modifications to the general exception handler that caused the processor to output, through uncached addresses, information about each exception as it occurred. Overall, this modification resulted in 9 extra instructions, including 6 uncached stores, per interrupt. Because of the position of these instructions within the interrupt handler, and assuming that the processor's write buffer was never "backed up," none of these instructions would have even caused a pipeline stall. Modifying the operating system to output Count register values resulted in the execution of 3 additional instructions each time the register was read.
Aside from the initial startup costs, overall system perturbation due to CITCAT was minor. During the sample tracing period shown in Fig. 4, the operating system processed 96 interrupts and read from Count 226 times, for a total of 678 extra instructions, or approximately 0.42% of all the 160,418 (non-idle loop) instructions executed. Most researchers would find such a small dilation acceptable.
The fact that CITCAT traces are computed, rather than stored, means that the CITCAT procedure has potential for development into an efficient trace storage and distribution mechanism. Suppose, for example, that we wish to send an instruction trace to a researcher at a distant location. Assuming that she has already obtained a functional, CITCAT-ready simulator, all we need to send her is an initial machine state and an event list. She can then use both of these records to generate the instruction trace.
For the R4400 system, the IMS consists of only the processor's registers and an initial memory image. For the sample trace used in this case study, the IMS required 16,773 (address, data) pairs, or 134,184 bytes of raw, uncompressed data. For long traces, however, the size of the IMS is probably irrelevant, since the maximum IMS size is bounded by the size of the machine state, which is governed mostly by the amount of main memory.
Fig. 5: Raw and compressed data sizes for R4400 CITCAT records. |
The event records required to keep an R4400 simulator running are (a) an asynchronous interrupt schedule, (b) a DMA schedule, (c) a device input queue, and (d) a Count register history. The raw uncompressed and gzip-compressed sizes for these records are shown in Fig. 5 (previous page). These figures indicate that the combined event records will allow the simulator to execute approximately 70 instructions for each byte of event record data. Assuming that approximately 10 bytes of raw data are required to store a single instruction trace entry (including the address, instruction, and operands), these figures suggest 700:1 lower bound for potential instruction trace compression. Note that because gzip is not designed to exploit the structure inherent in these AES records, actual achievable compression ratios, using optimal representations for each record to eliminate redundancy, are probably much higher.
Instruction traces give researchers valuable insights into the performance characteristics of the systems being traced, but are difficult to acquire without perturbing the system. Traditional tracing techniques have been used to produce instruction traces, but the cost of these techniques, in terms of trace accuracy or implementation difficulty, has generally been unacceptably high. CITCAT is a modern approach to instruction trace generation that combines features from older techniques, while avoiding or minimizing disadvantages normally associated with them.
CITCAT utilizes simulation to convert cache-filtered address traces into accurate and detailed instruction traces. Although a significant performance penalty must be endured at the beginning of a CITCAT trace, after the system has "warmed up," the overall impact of CITCAT on system performance is negligible, and the resulting instruction traces might be justifiably called "nearly perfect."
Research on CITCAT is ongoing, and there are still many directions to explore in this area. CITCAT has been successfully implemented for Intel 80x86 and R4400 processors and hopefully will be developed for additional architectures in the future.
Because CITCAT computes instruction traces, rather than storing them, CITCAT has great potential for development into an efficient trace storage and distribution mechanism. Lossless instruction trace compression ratios exceeding 700:1 may eventually be possible. CITCAT may become the standard for efficiently storing and distributing high-quality instruction traces.
J. Kelly Flanagan: "A national trace collection and distribution resource" (1998).
Jeffrey Dean, James E Hicks, Carl A. Waldspurger, William E. Weihl, George Chrysos: "ProfileMe: hardware support for instruction-level profiling on out-of-order processors" in Proceedings of the Thirtieth Annual IEEE/ACM International Symposium on Microarchitecture (1997), pp. 292-302.
C. Chekuri, R. Johnson, R. Motwani, B. Natarajan, B. R. Rau, M. Schlansker: "Profile-driven instruction level parallel scheduling with application to super blocks" in Proceedings of the 29th Annual IEEE/ACM International Symposium on Microarchitecture (1996), pp. 58-67.
Chris Stephens, Bryce Cogswell, John Heinlein, Gregory Palmer: "Instruction level profiling and evaluation of the IBM RS/6000" in Proceedings of the Eighteenth International Symposium on Computer Architecture (ACM 1990), pp. 180-189.
Chih-Po Wen: "Improving instruction supply efficiency in superscalar architectures using instruction trace buffers" in Proceedings of the 1992 ACM/SIGAPP Symposium on Applied Computing (vol. I): Technological Challenges of the 1990's, pp. 28-36.
Douglas W. Clark, Joel S. Emer: "Performance of the VAX-11/780 translation buffer: simulation and measurement" in ACM Transactions on Computer Systems (February 1985, vol. 3 no. 1), pp. 31-62.
D. Nagle, R. Uhlig, T. Stanley, S. Sechrest, T. Mudge, R. Brown: "Design tradeoffs for software-managed TLBs" in Proceedings of the Twentieth International Symposium on Computer Architecture (ACM 1993), pp. 27-38.
Susan J. Eggers, David R. Keppel, Eric J. Koldinger, Henry M. Levy: "Techniques for efficient inline tracing on a shared-memory multiprocessor" in Proceedings of the 1990 Conference on Measuring and Modeling of Computer Systems (Performance Evaluation Review, Special Issue, May 1990, Vol. 18 No. 1), pp. 37-45.
J. Kelly Flanagan, Brent E. Nelson, Greg Thompson: "The inaccuracy of trace-driven simulation using incomplete multiprogramming trace data" in IEEE International Workshop on Modeling, Analysis and Simulation of Computer and Telecommunications Systems (MASCOTS Feb. 1996).
Richard M. Fujimoto, William C. Hare: "On the accuracy of multiprocessor tracing techniques" (Georgia Institute of Technology report GIT-CC-92-53, June 1993).
J. Kelly Flanagan, Brent E. Nelson, James K Archibald, Knut Grimsrud: "Incomplete trace data and trace driven simulation" in Proceedings of the International Workshop on Modeling, Analysis and Simulation of Computer and Telecommunication Systems (MASCOTS SCS 1993), pp. 203-209.
Knut Grimsrud, James Archibald, Richard Frost, Brent Nelson, Kelly Flanagan: "Estimation of simulation error due to trace inaccuracies" in IEEE Asilomar Conference (Oct. 1992).
Anita Borg, R. E. Kessler, Georgia Lazana, David W. Wall: "Long address traces from RISC machines: generation and analysis" in Western Research Laboratory Research Report 89/14 (Sept. 1989).
Thomas Ball, James R. Larus: "Optimally profiling and tracing programs" in ACM Transactions on Programming Languages and Systems (July 1994, Vol. 16 No. 4), pp. 1319-1360.
A. Borg, R. E. Kessler, D. W. Wall: "Generation and Analysis of Very Long Address Traces" in Proceedings of the Seventeenth International Symposium on Computer Architecture (ACM 1990), pp. 270-279.
David A. Patterson, John L. Hennessy: Computer Architecture: A Quantitative Approach (1996). Morgan Kaufmann Publishers, Inc.
K. Grimsrud, J. Archibald, M. Ripley, K. Flanagan, B. Nelson: "BACH: a hardware monitor for tracing microprocessor-based systems" in Microprocessors and Microsystems (October 1993, vol. 17 no. 6).
MIPS Computer Systems, Inc.: RISCompiler Languages Programmer's Guide (1988).
Douglas W. Clark: "Cache performance in the VAX-11/780" in ACM Transactions on Computer Systems (February 1983, vol. 1 no. 1), pp. 24-37.
Josep Torrellas, Anoop Gupta, John Hennessy: "Characterizing the caching and synchronization performance of a multiprocessor operating system" in Proceedings of the Fifth International Conference on Architectural Support for Programming Languages and Operating Systems (ACM 1992), pp. 162-174.
J. Kelly Flanagan, Brent E. Nelson, James K Archibald, Knut Grimsrud: "BACH: BYU Address Collection Hardware, the collection of complete traces" in Proceedings of the Sixth International Conference on Modeling Techniques and Tools for Computer Performance Evaluation (1992), pp. 128-137.
Emmett Witchel, Mendell Rosenblum: "Embra: fast and flexible machine simulation" in Proceedings of the 1996 International Conference on Measurement and Modeling of Computer Systems (Performance Evaluation Review, Special Issue, May 1996, Vol. 24 No. 1).
Bob Cmelik, David Keppel: "Shade: a fast instruction-set simulator for execution profiling" in Proceedings of the 1994 Conference on Measurement and Modeling of Computer Systems, pp. 128-137.
Charlton D. Rose, J. Kelly Flanagan: "Constructing Instruction Traces from Cache-filtered Address Traces (CITCAT)" in ACM's Computer Architecture News (Dec. 1996).
David A. Patterson, John L. Hennessy: Computer Organization & Design: The Hardware/Software Interface (1998). Morgan Kaufmann Publishers, Inc.
Joe Heinrich: MIPS R4000 Microprocessor User's Manual (1994). MIPS Technologies, Inc.